![<?echo $_SERVER['SERVER_NAME'];?>](/template/twentyseventeen/skin/images/header.jpg)
1. Principles of on-line monitoring of insulation parameters of low-voltage cables in mines Insulation monitoring devices based on zero-sequence voltage and leakage protection devices based on power direction have been used in coal mines for a long time. The former can't reflect the change after the three-phase insulation of the power grid drops symmetrically; the latter only sends the trip signal after the cable has leaked, and can't make accurate prediction of the insulation level of the power grid before the single-phase earth fault occurs. In view of its shortcomings, this article adopts an on-line monitoring method of cable insulation parameters based on the detection of additional low-frequency power. This method can not only achieve on-line monitoring of insulation parameters of each branch cable to ground, but also can achieve selective protection of the power grid.
The basic principle of the additional low-frequency power method is to add a low-frequency power signal to the three-phase AC power grid. The low-frequency power enters the power grid through the three-phase reactor, and then the ground capacitance and insulation resistance of the power grid enter the ground to form a low-frequency current loop. By processing and calculating each low-frequency current signal, the insulation of each branch cable can be obtained. The resistance condition enables on-line monitoring.
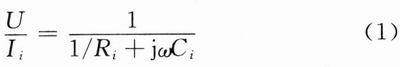
For low-frequency signals, the reactance values ​​introduced by the three-phase reactors and the line impedance are extremely small and are negligible compared to the insulation impedance of the low-voltage network. Therefore, the equivalent circuit shown in Fig. 1 can be obtained.
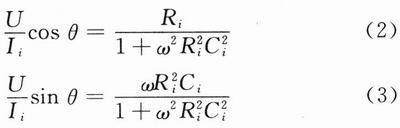
The insulation parameters of any branch can be calculated as follows:
Formula (1) can be equivalent to the following two formulas:
From equation (2), equation (3):
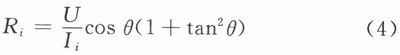
When the grid insulation parameters are symmetrical:
Where: U is the low-frequency voltage value; ω is the angular frequency; θ is the phase angle; Ii is the ith branch of the low-frequency current value; Ri is the total value of the i-th branch insulation resistance; Ci is the i th branch total capacitance Values; RiA, RiB, RiC are the A-phase, B-phase, and C-phase insulation resistance values ​​of the i-branch, respectively.
2. Establishment and implementation of the system model This paper uses Matlab software to simulate. The application of Matlab in power system has been quite mature. In the Simulink environment, select each module required for system simulation in the power system simulation module library and build a simulation model, as shown in Figure 2.
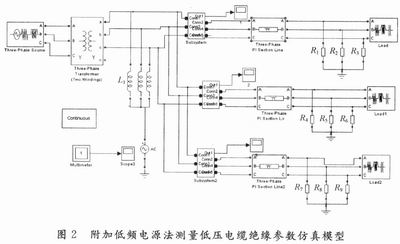
Use an ideal three-phase voltage source as the power supply for the line. The line voltage is 0.4kV and the frequency is 50Hz. The low-frequency power signal is set to have a voltage amplitude of 20V and a frequency of 10Hz, using a π-type equivalent circuit. The positive sequence parameters of the line are: R1=O.20Ω, L1=O.40mH, and C1=0.1μF. The zero-sequence parameters are: R0=O.23Ω, L0=1.72mH, and C0=O.08μF. The simulation model contains a total of 3 cable lines.
3, simulation analysis According to the selected module and set the simulation parameters for simulation, get the waveform diagram of Figure 3.

As can be seen from Figure 3, on the fault branch, the low-frequency current of 1OHz detected by the zero-sequence current transformer is far greater than the intact branch of the insulation resistance, and the faulty branch is relative to the low frequency current on the fault branch. Leakage currents can be ignored. In this way, the fault branch and the non-failure branch can be easily distinguished, so that the fault branch can be selectively cut off.
When the insulation parameters are changed, a simulation is performed. Based on the measured low-frequency current value and its phase angle, the insulation parameter parameters of the generation can obtain the insulation parameter values ​​under various insulation conditions.
From the simulation results, it can be seen that during the operation of the cable, fault branches can be detected by analyzing and analyzing additional low-frequency signals. Regardless of whether or not the cables are relatively insulated, this method can reflect the changes. It can not only accurately predict the insulation level of the power grid before a single-phase ground fault occurs, but also can selectively predict the failure of the insulation level. This selection method is simple and easy, and has nothing to do with the neutral grounding of the transformer. This insulation monitoring method can be applied to various power grid protection systems and is more versatile. Overcoming the limitations of the leakage protection device based on the power direction and the insulation monitoring method based on the zero-sequence voltage, and fault line selection can be realized in the event of a fault.
Through the simulation and statistics, it can be seen that the following problems need to be paid attention to in the additional low-frequency power supply method.
3.1 Detection of Insulation Resistance Accuracy Decreases with Branch-to-Ground Capacitance In order to obtain the relationship between grounding resistance measurement accuracy and capacitance, two types of fault branch grounding resistances of 100kΩ, 1OkΩ, and various grounding resistances are set. In this case, the fault branch circuit capacitance is changed from 0 to 5μF.
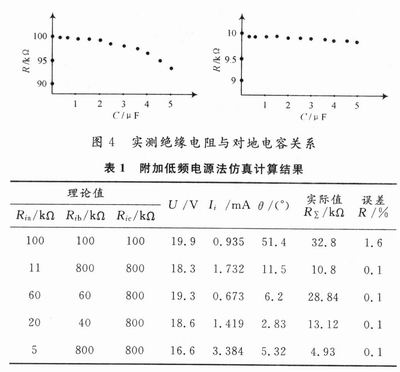
Through the actual measurement, the impact of the capacitance of the ground on the measurement accuracy of various grounding resistances is obtained (Figure 4). As can be seen from FIG. 4 , the detection accuracy of the ground resistance decreases as the branch-to-ground capacitance increases, and for the same capacitance, the error increases as the ground resistance increases. This is because the higher the insulation resistance, the smaller the resulting measured signal.
3.2 The increase of the capacitance of the grid to ground The effect of the fault branch positioning is shown in Table 2. Ii is the fault branch leakage current and Ik is the maximum non-fault branch leakage current. The grounding resistance is 1kΩ, the low-frequency voltage amplitude is 20V, and the frequency is 10Hz.
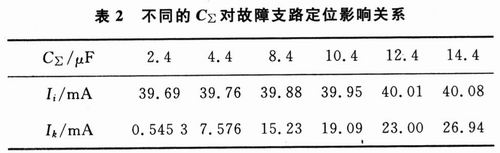
When the capacitance of the cable to the subdivision section changes, the leakage current of the non-fault branch gradually approaches the leakage current of the fault branch. At this time, the leakage current in the cable is basically a capacitive current, and the resistive current is negligible. At this time, faults and non-faulty branches cannot be distinguished.
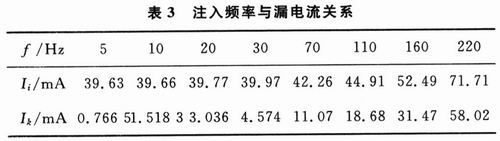
3.3 Selection of injection frequency The choice of injection frequency has a direct impact on the effect of additional low-frequency power method applied to grid insulation fault location. As shown in Table 3, the frequency of the test power supply is changed. When the frequency increases, the low-frequency current in the measurement loop continuously increases, mainly due to the influence of capacitive current, because I=ωCU increases with frequency, and the capacitive current follows. The larger the injection frequency is, the smaller the leakage current of the faulty branch and the non-faulted branch is, which makes it difficult to implement fault line selection.
For this purpose, the frequency of the injected signal should be determined according to the following principles:
(1) The injection frequency should be as low as possible to minimize the influence of the grid-to-ground capacitance on the detection accuracy. At the same time, the injection frequency below 50 Hz will not conflict with the normal operating frequency of the grid.
(2) The frequency of the injected sine wave is stable, the waveform distortion coefficient is small, and the signal is easy to extract.
(3) To ensure the sensor's measurement accuracy for weak currents.
Considering the above factors comprehensively, we can choose 10Hz as the injection frequency. In this way, the industrial frequency is the whole harmonic of the injection frequency. When using the full-week Fourier calculation, it can effectively eliminate the 50Hz power frequency load signal and other higher harmonics. influences.
4. Measurement error analysis Due to the amplitude and phase errors that may occur during the transmission and extraction of current and voltage in the actual system, the calculation results may be adversely affected. According to equation (4), it can be seen that the relative error of the insulation resistance measurement and the voltage and current module measurement error satisfy the following relationship:
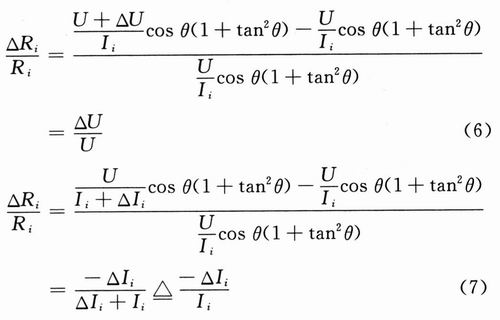
From equation (6), it can be seen that the insulation resistance measurement error is proportional to the voltage amplitude measurement error. When the voltage amplitude error increases or decreases, the Ri value calculation result will increase or decrease accordingly. From Equation (7), the influence of the current amplitude is the opposite. When the current module error increases or decreases, the Ri value calculation result will be reduced or increased accordingly. It can be seen from the above error analysis that in practical engineering applications, Insulation resistance measurement accuracy is mainly affected by current and voltage sensor amplitude error, which can be used as reference for sensor design and selection.
5. Conclusion The theoretical analysis and simulation calculations show that it is feasible to use the additional low-frequency power supply method to conduct on-line insulation monitoring of underground low-voltage power grids. Through it, the insulation level of the power grid can be observed from time to time, which has a good engineering application prospect.
Semi-refined Paraffin Wax is white solid. Its relative density increases with the increase of melting point. The product has good chemical stability, moderate oil content and good quality.
Good moisture resistance and insulation performance, good plasticity. The candle flame produced by semi-refined paraffin wax is concentrated, smokeless, and does not cry.
Semi Refined paraffin wax is used in candles, crayons, wax paper, general telecommunications equipment and short circuit and light industry, chemical raw materials.
Semi-refined is a plate-like white solid. Its relative density increases with the rise of melting point. The product has good chemical stability, moderate oil content, good moisture resistance and insulation properties, and good plasticity. The candle produced by semi-refined paraffin wax has concentrated flames and no smoke , Do not shed tears.
This product is used in candles, crayons, wax paper, general telecommunication equipment and short circuit and light industry, chemical raw materials.
Semi Refined Paraffin Wax,Semi-Refined Paraffine Wax,Wax Candles Semi Refined Paraffin,Candle Making 58 Melting Point
Henan Shunbang Chemical Industry CO.,Ltd , https://www.suspensionpvc.com